The ETF Expense Ratio That Excludes a Broker’s 0.03% Order Routing Fee
When you buy an exchange-traded fund, the first cost you see is the expense ratio—often a slender 0.03% for a broad-market index fund. That number feels so small you might ignore it. But there is a second cost, roughly the same size, that never appears in the fund's prospectus: the order routing fee. Your broker collects it, a market maker pays it, and you absorb it through a slightly worse execution price. Over decades, this hidden drag can cost more than the expense ratio itself.
The Sticker Price vs. the True Cost
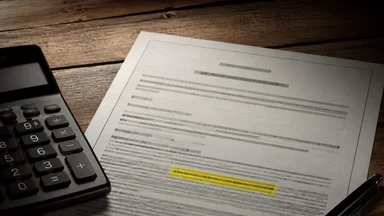
The expense ratio is the fee the fund charges for managing your money. It covers portfolio rebalancing, administrative costs, and the fund manager's profit. For a popular ETF like one tracking the S&P 500, that ratio might be 0.03% annually—$3 per $10,000 invested. That is the sticker price.
The true cost, however, includes the brokerage fee embedded in the trade. When you place a market order to buy $10,000 of an ETF, your broker routes that order to a market maker like Citadel Securities or Virtu Financial. The market maker executes the trade at a price slightly worse than the public quote—typically around 0.03% worse, according to SEC estimates. That slippage is the order routing fee. It is not a line item on your statement, but it is real money.
Together, the expense ratio and the routing fee add up to roughly 0.06% per year if you trade once and hold. But if you trade frequently—say, monthly dollar-cost averaging—the routing fee applies every time. A monthly investor could see an annual drag of 0.36% from routing fees alone, far exceeding the expense ratio.
The fund manager and the broker have misaligned incentives. The fund manager wants you to focus on the low expense ratio to attract assets. The broker wants to maximize routing revenue. Neither is motivated to highlight the combined cost.
How Payment for Order Flow Works
Payment for order flow (PFOF) is the mechanism behind the hidden fee. Your broker receives a small payment from a market maker for directing trades to them. In return, the market maker gets the chance to profit from the spread—the difference between the bid and ask price. The broker's incentive is to route to the highest-paying market maker, not necessarily the one offering the best price.
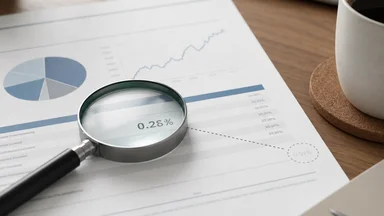
The SEC has estimated that the average cost of PFOF to retail investors is about 0.03% per trade. This is not a commission you see on your confirmation slip; it is embedded in the trade price. For a $10,000 trade, that is $3. If you trade 12 times a year via monthly contributions, that is $36 annually—0.36% of a $10,000 portfolio. On a $100,000 portfolio, the annual cost climbs to $360.
Major market makers like Citadel Securities and Virtu Financial process a large share of retail order flow. They use sophisticated algorithms to capture small price advantages on each trade. While the per-trade cost is tiny, the volume is enormous. In 2023, PFOF payments to brokers exceeded $1 billion, according to industry reports.
Brokers vary in their use of PFOF. Fidelity does not accept payment for order flow; instead, it internalizes trades within its own system. Robinhood relies heavily on PFOF as a primary revenue source. The choice of broker directly affects whether you pay this hidden fee.
Where the Fee Appears on Your Statement
The order routing fee does not appear as a line item on your brokerage statement. It is not listed under “fees and expenses” or “commissions.” Instead, it is reflected in the execution price you receive. If the ETF's net asset value is $100 per share, and the market quote shows a $100.01 ask and $99.99 bid, your market order might execute at $100.02—a penny above the ask. That penny is the routing fee.
This is different from a 12b-1 fee, which is a marketing fee charged by some mutual funds and disclosed in the prospectus. Routing fees are not disclosed in any fund document. They are a cost of the brokerage service, not the fund itself. The broker's revenue from routing is reported quarterly in SEC Rule 606 reports, but these documents are dense and rarely read by individual investors.
When you look at your portfolio's performance, you see the net asset value returns minus the expense ratio. The routing fee is invisible because it is already subtracted from your purchase price or added to your sale price. Over time, this creates a gap between the fund's reported return and your actual return.
Some brokers are beginning to offer more transparency. For example, Schwab publishes a quarterly “order execution quality” report that shows the price improvement (or lack thereof) on retail trades. But even then, the dollar amount of routing fees is not presented as a simple fee. The investor must do the math.
Why 0.03% Matters for Long-Term Returns
On a single trade, 0.03% seems negligible. But compounding turns small leaks into large losses. Consider an investor who contributes $10,000 per year to an ETF, making 12 monthly trades of roughly $833. Over 20 years, assuming a 7% annual return, the routing fee of 0.03% per trade adds up to an estimated $10,000–$12,000 in lost growth, depending on the exact fee and market conditions.
To put that in perspective, the expense ratio on the same portfolio would cost roughly $4,000–$5,000 over 20 years. The routing fee more than doubles the total cost. Yet most investors never account for it. When comparing ETFs, they look only at expense ratios, ignoring the brokerage layer.
The drag is even larger for active traders. Someone who rebalances quarterly or trades options frequently could see routing fees consume 0.5%–1% of their portfolio annually. For a day trader, the cost can be substantial relative to gains.
Some argue that PFOF improves execution quality because market makers compete for order flow, leading to better prices on average. A 2020 SEC study found that retail investors received slightly better prices than the national best bid and offer, even after accounting for PFOF. But that improvement is not guaranteed, and the fee structure remains opaque.
Comparing Brokers: Who Discloses Routing Fees?
Brokers vary widely in how they handle order routing. At one end are brokers that accept PFOF and disclose it only in regulatory filings. Robinhood, for example, generates a large portion of its revenue from PFOF. Its zero-commission model is subsidized by routing fees. The cost to the investor is not zero; it is hidden.
At the other end are brokers that reject PFOF entirely. Fidelity routes orders to multiple market makers without accepting payments, and it internalizes some trades at prices that match or beat the public quote. Vanguard also minimizes routing revenue, though it is not zero. Schwab uses PFOF but publishes detailed execution quality statistics, allowing investors to gauge the cost.
To compare brokers, you can request their SEC Rule 606 reports, which list the venues they route to and the payments received. However, these reports do not translate directly into a per-trade cost. Some third-party sites attempt to estimate routing fees by comparing trade prices across brokers, but the data is noisy.
As of early 2025, the SEC has proposed new rules that would require brokers to disclose routing fees in dollars and cents on trade confirmations. The proposal remains under review, with industry groups arguing that the cost is already reflected in execution price. Until the rule changes, investors must do their own homework.
How to Hedge Against Hidden Routing Costs
You can reduce or eliminate routing fees with a few behavioral changes. The most effective is to use limit orders instead of market orders. A limit order sets the maximum price you are willing to pay (or minimum you will accept). When you use a limit order at the current ask price, the broker cannot route the order to a market maker that offers a worse price. The fee effectively disappears because you control the execution price.
Another strategy is to choose a broker that does not accept PFOF. Fidelity and Vanguard are popular options. Their zero-commission trades are not subsidized by routing fees, so the execution price is closer to the public quote. For long-term buy-and-hold investors, the difference is small, but for frequent traders, it matters.
You can also check your broker's Rule 606 report to see if they route to high-paying venues. If the report shows a large concentration of orders sent to a single market maker, that is a red flag. Consider switching brokers if the routing practices are not in your favor.
For ETF investors, consider direct-indexing products that bypass the brokerage layer entirely. These are portfolios of individual stocks that replicate an index, and trades are executed by the manager at institutional prices. The fees are higher—typically 0.10%–0.20%—but there is no routing fee on each trade because the manager aggregates orders.
The Regulatory Gap That Allows This
The SEC has long required brokers to disclose order routing information under Rule 606, but the data is not presented as a simple fee. Investors must parse quarterly reports that list venues and payment amounts, then estimate the cost per trade. Few do. The gap between what is disclosed and what is understandable is wide.
In 2024, the SEC proposed a rule that would require brokers to disclose the amount of payment for order flow on trade confirmations in dollars and cents. The proposal also sought to cap PFOF on certain trades. Industry lobbying has been intense, with arguments that PFOF lowers costs for retail investors and that disclosure would confuse clients. As of mid-2026, the rule has not been finalized.
Meanwhile, the Federal Reserve's enforcement actions and discount rate meetings—like those reported in May 2026—have no direct impact on PFOF. The regulatory gap persists because securities regulation falls under the SEC, not the Fed. Investors must educate themselves until the rules catch up.
Some market participants argue that the current system is efficient: PFOF allows zero-commission trading, and the execution quality is good enough that the fee is a fair trade. Others counter that the fee is a tax on unsophisticated investors who use market orders. Both sides have evidence, but the lack of transparency makes it hard for individuals to decide.
For now, the burden is on you to look beyond the expense ratio and ask where your order is going. The difference between a 0.03% expense ratio and a 0.06% total cost is the difference between a visible fee and a hidden one. In a world of compounding, that gap matters.
Real-World Examples of Hidden Routing Costs
Consider an investor named Sarah who contributes $500 monthly to an S&P 500 ETF at a broker that uses PFOF. Over 30 years, with a 7% annual return, the 0.03% per-trade routing fee reduces her final balance by roughly $15,000 compared to a broker without PFOF. In contrast, her friend Tom uses a broker that does not accept PFOF and places limit orders. Tom's final balance is $15,000 higher, despite both investing the same amount in the same ETF.
Another example: a retiree named John holds a $500,000 portfolio and rebalances quarterly, resulting in four trades per year. The routing fee on each trade (0.03%) costs $150 per trade, totaling $600 annually. Over 20 years, that adds up to $12,000 in lost growth, assuming a 5% return. If John had used a broker like Fidelity, he would avoid most of that cost.
Trade-Offs: Limit Orders vs. Market Orders
Using limit orders eliminates routing fees but introduces the risk of partial fills or no fill at all. For highly liquid ETFs like IVV (iShares Core S&P 500 ETF) with millions of shares traded daily, a limit order at the ask price usually fills instantly. But for less liquid ETFs, a limit order may sit unfilled if the market moves away. In fast-moving markets, a market order guarantees execution but at a potentially worse price due to routing fees. The trade-off is between certainty of execution and cost control.
Some brokers offer smart order routing that attempts to get the best price across multiple venues, reducing but not eliminating routing fees. For example, Schwab's routing algorithm may send your order to a venue that offers price improvement, effectively lowering the fee. However, the fee is still embedded in the execution price.
Another trade-off: direct-indexing products avoid routing fees but charge higher management fees (0.10%–0.20% vs. 0.03% for an ETF). For large portfolios, the higher management fee may outweigh the routing fee savings. For example, on a $1 million portfolio, a 0.10% direct-indexing fee costs $1,000 per year, while routing fees on 12 trades per year cost $360. The direct-indexing product is more expensive unless the investor trades very frequently.
This article is for informational purposes only and does not constitute personalized investment advice. Consult a financial professional before making investment decisions.